This article describes the statistical analysis and sensor correction used in the HEXTA electronic target system (patents granted). The description uses the data taken from a single, real shot which was fired at 300m distance using a 308 projectile. This particular shot was selected to demonstrate the method because it has a large acoustic sensor error .
A note on errors
This article uses the word “error” in two contexts.
- One is the shooter’s error – the distance of the shot from the centre of the target. In this article, this is referred to as the “shooter’s error”.
- The other is the error of determination of the position of a shot by the electronic target – the distance between the determined position and the actual position. This is referred to simply as “error”.
Acoustic errors are an unavoidable reality of acoustic based systems. Acoustic errors and their sources will be discussed in a separate topic.
Actual shot position
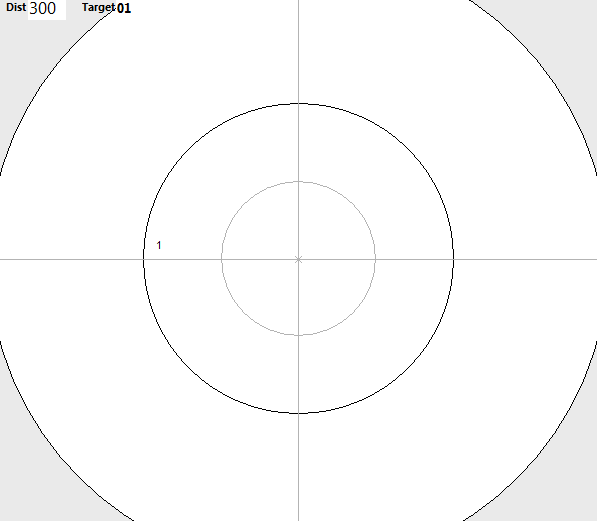
The actual position of projectile’s impact point is shown in the picture below (full ICFRA 300m target 1200×1200). This was determined by accurately measuring the physical point of impact on the target. The method of measurement is not described in this article.
 The centre of the target above is magnified in the picture below. The pictures also show 1′ grid.
 The coordinates of the shot reported by the HEXTA system were x=-33.41mm, y=6.16mm, and an offset from the centre of 37mm (shooter’s error). This corresponded exactly with the position of the physical shot.
3-sensor system
A minimum of three acoustic sensors is required to make a single determination of the position of a shot. An error in one or more of these three sensors will result in an error in the determined position.
The picture below shows a single point as determined by three of the HEXTA’s eight sensors, using the above shot data. The three sensors were selected to include one with a known, significant error.
 The error (5 mm from the true position) is clearly visible, but with only three sensors the software is unable to identify this error or determine its magnitude.
4-sensor system
A 4-sensor system can calculate four approximate shot positions because there are four possible 3-sensor combinations, or “triads”.
The picture below shows these four points calculated from four HEXTA sensor inputs. Once again, the sensors were selected to include one with a known significant error. The red cross is the average position of these points.
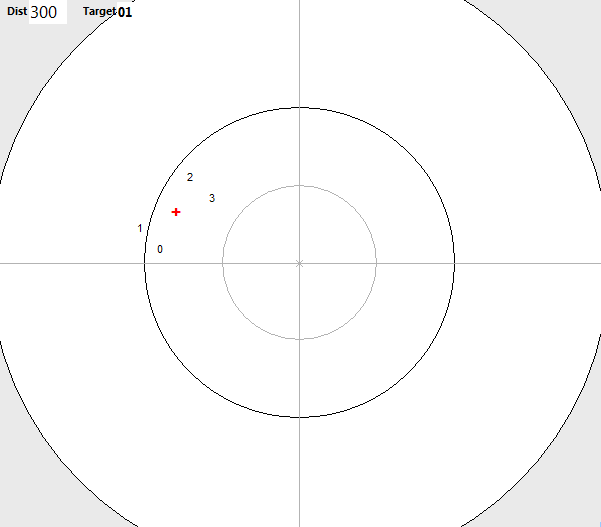 Here we can see that only one combination (1) is correct, and the other three are affected by the erroneous sensor. The average result has an actual error of 7 mm.
The average of the 4 points in the 4-sensor system reduces the error introduced by the faulty sensor as opposed to the 3-sensor system.
In case of a wide spread of data points, as in the example above, the software may detect presence of an error in the sensor input and inform the user or reject the shot, although it is unable to determine which sensor or sensors caused the error.
However, if an error occurs in more than one sensor simultaneously (as may occur through electromagnetic interference or acoustic noise), the spread of results may be small, and the shot accepted as valid, but the average result may still be wrong. The picture below shows such a condition, using four of the HEXTA sensors, two of which were known to be erroneous. 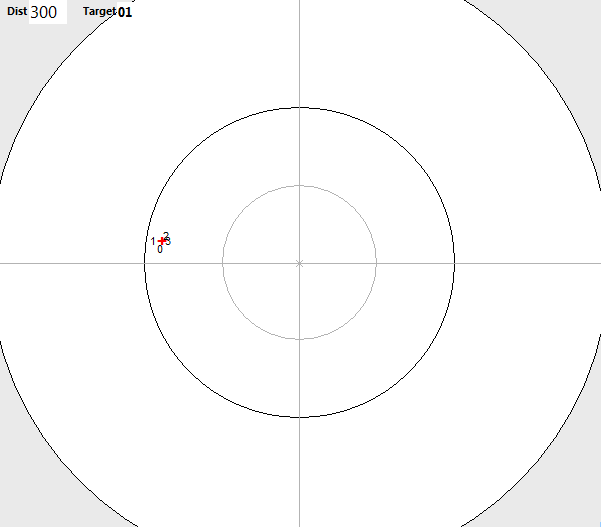 As you can see the spread of determinations is small and the shot would be considered valid, but the averaged result has an error of about 6 mm, and on the wrong side of the circle to the true shot position.
8-sensor system
As the number of sensors in the system increases, the number of possible 3-sensor triads increases rapidly. With five or more sensors, it is possible not only to identify faulty sensors but also to apply corrections to those sensors. The more sensors used, the greater the probability of identifying faulty sensors, and the more accurate the corrections.
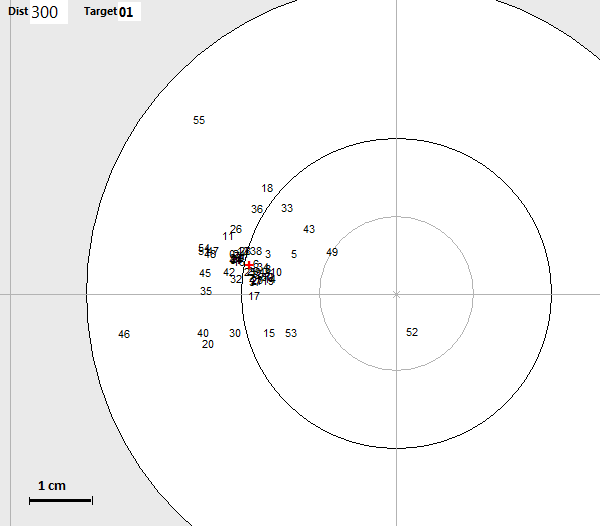
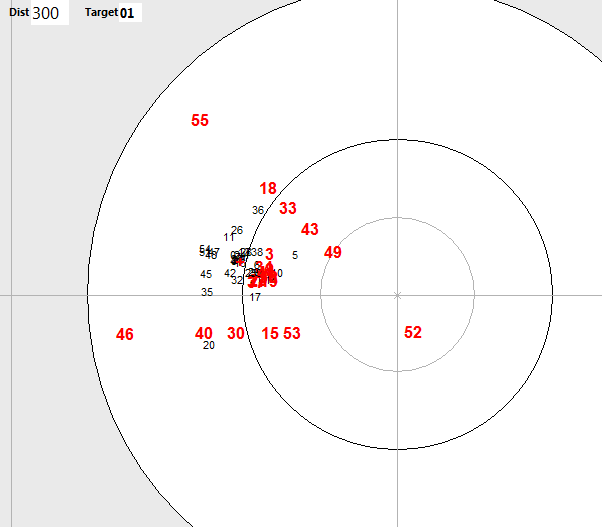
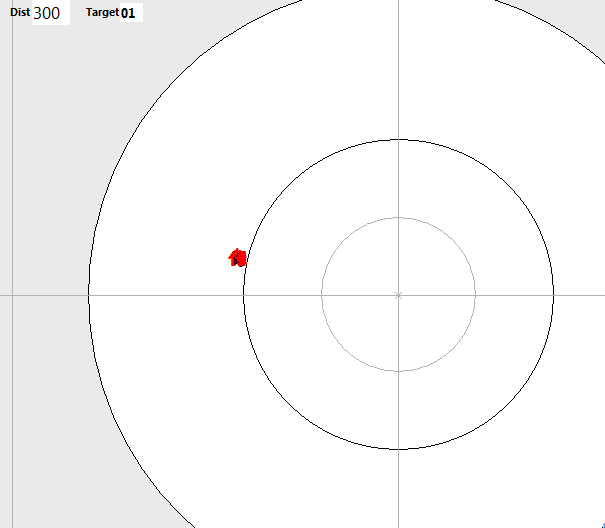
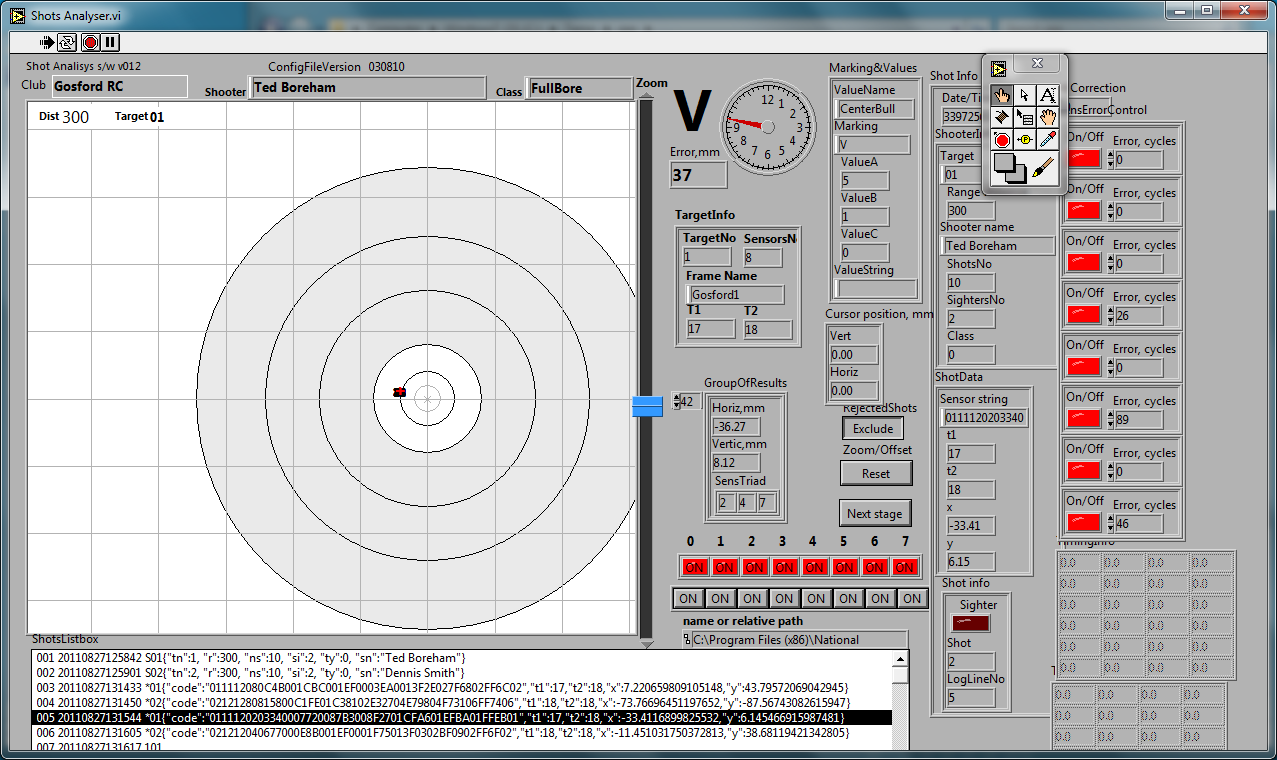
The eight sensors in the HEXTA system result in 56 triads. The picture below is a screen shot of the HEXTA system data simulation and analysis software.  This picture shows the cluster of all 56 data points for the shot , which includes some erroneous data from the sensors. The red cross is the 2D average of all these points.
The “Error” field (just to the top right of the target screen) shows the shooter’s error – i.e.: the distance from the calculated shot to the centre of the target. It shows that the shot hit the target 34 mm from the centre.
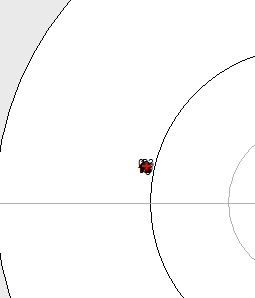
The picture below-left shows a close-up of this cluster. The HEXTA software analysed the data and identified sensor no. 5 as having the greatest error. The picture below-right shows the same cluster but highlighting in red only those data points affected by sensor no. 5.
The picture below-left shows the remaining data points after those involving sensor no. 5 were excluded by the software, and the new average (the red cross).
The same method was then repeated. The picture below-right shows in red the data points affected by the next most erroneous sensor, no. 7.


The picture below-left shows the cluster after sensor no. 7 has been also excluded. The picture below-right shows in red the data points affected by sensor no. 3.


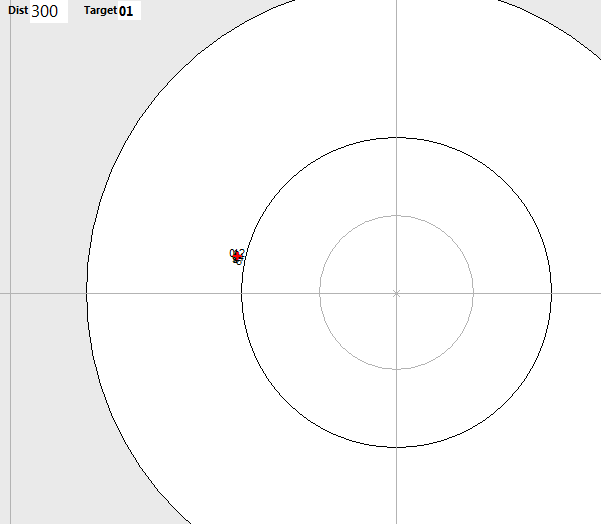
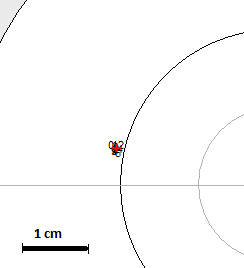
The picture below-left shows the cluster after all three erroneous sensors (5, 7 and 3) have been excluded, so only the data from five sensors 0, 1, 2, 4 and 6 remain. The picture below-right shows it in higher magnification.
As a result of this analysis and exclusion of erroneous data, the error (3 mm) was eliminated and the calculated shot position “moved” by 3 mm to the correct position (37 mm off-centre).
By excluding the data from 3 of the 8 sensors, there remain only 10 of the initial 56 points, but the spread has been greatly reduced. Clearly this will result in a more accurate average position.
8-sensor system with error correction
The description above is of a method of identifying erroneous sensor data and eliminating it from the data set. The following describes a method for further analysis of the data and the automatic correction of erroneous data.
Sensor no. 3 is used as an example.
The picture below-left shows the data related to sensor no. 3 highlighted in red. For clarity, data related to sensors nos. 5 and 7 have already been excluded. The black cluster shows all remaining data points.
The picture below-right shows the data for sensor no. 3 only “half-corrected”. This intermediate step is shown for illustration only; the software does not perform this step.
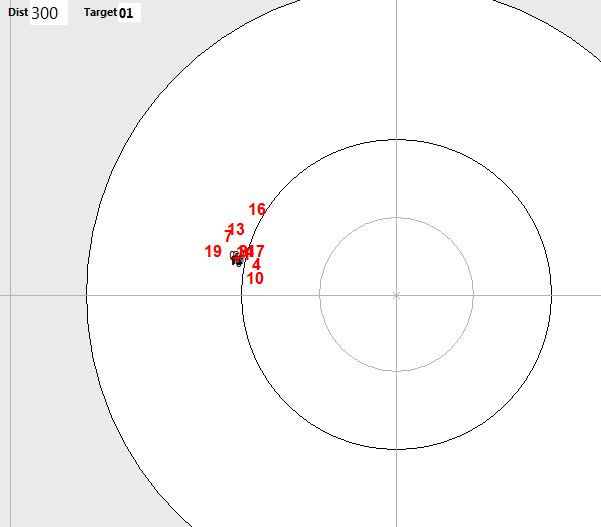

The picture below-left shows in red the fully corrected data for sensor no. 3. The numbers cannot be read as they are printed on the top of each other. The picture below-right is a magnified version of the calculated shot using 6 sensors, including the corrected sensor no. 3.
The same method is then applied to sensor no. 7 (not shown here) and then to sensor no. 5 (shown below).
The pictures below show the data for sensor no. 5. Below-left is uncorrected data; below-right is half-corrected.


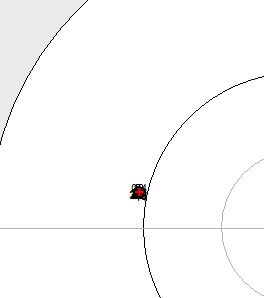
The picture below-left shows the data for all eight sensors after corrections have been applied to sensors nos. 3, 7 and 5. The picture below-right shows a close-up of the same cluster.
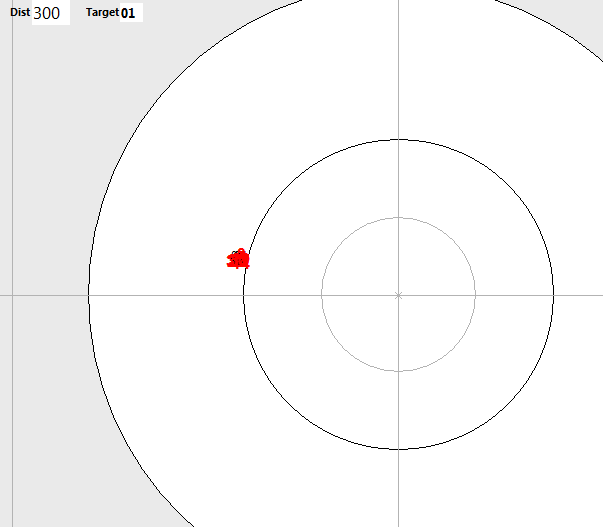
The picture below shows the fully corrected data displayed on the analysis software. The fully corrected shooter’s error was 37 mm, compared to 34 mm uncorrected. The corrected result corresponds exactly with the measured true position of the shot.
The HEXTA system collects error information for each shot and for each sensor, and when sufficient data is available it applies the correction factor to each sensor permanently.
By correcting erroneous data rather than simply eliminating it, all sensors continue to contribute to each shot measurement, thus ensuring the highest probability of accurate results.
The error data allows the software to report on the health of the system, which could be updated as the errors vary over time.
Leave a Reply